DOI:http://doi.org/10.65613/743132
- Mouna KHELEF
Department of Management Sciences, Faculty of Economic, Commercial and Management Sciences, University of El Oued, El-Oued 39000. Algeria
E-mail : [email protected]
ORCID iD: https://orcid.org/0000-0002-1969-5901
- Hanane Beggat
Department of Management Sciences, Faculty of Economic, Commercial and Management Sciences, University of El Oued39000 , El Oued, Algeria
E-mail: [email protected]
ORCID iD: https://orcid.org/0000-0001-9247-2029
- Ichraq Benzaoui
Department of Management Sciences, Faculty of Economic, Commercial and Management Sciences , University of Ouargla, Ouargla, Algeria
E-mail : [email protected]
ORCID iD: https://orcid.org/0009-0007-0717-2146
- Zakia MAHLOUS
Department of Management Sciences, Faculty of Economic, Commercial and Management Sciences, University of El Oued, El-Oued 39000. Algeria
E-mail : [email protected]
ORCID iD: https://orcid.org/0000-0002-3878-0298
- Sakina Hamlaoui
Department of Economic Sciences, Faculty of Economic, Commercial and Management Sciences, University of El Oued, El-Oued 39000. Algeria
E-mail : [email protected]
ORCID iD: https://orcid.org/0000-0003-4396-3694
Received date: 10/05/2026 Revised date: 03/09/2026 Publication date: 23/10/2026
Abstract
Knowledge has become central to nations’ economic and social capacities and to the expansion of human capabilities and opportunities. This study examines how selected knowledge-economy pillars (tertiary enrollment, Internet use, resident patent applications, and scientific and technical articles) relate to the Human Development Index (HDI) in eight Arab countries over 2010–2022, controlling for GDP per capita. Data come from the World Bank’s World Development Indicators and the UNDP Human Development Reports. The analysis relies on second-generation panel techniques, namely the Pesaran CD test, the Pesaran–Yamagata slope homogeneity test, the CIPS unit root test, and the Westerlund cointegration test, with relationships estimated through the Common Correlated Effects Mean Group (CCEMG) and Augmented Mean Group (AMG) estimators, which account for the cross-sectional dependence and slope heterogeneity detected. Because the Westerlund test does not confirm cointegration, coefficients are interpreted as average associations, not long-run effects. Under CCEMG, tertiary enrollment, Internet use, and GDP per capita are positively and significantly associated with the HDI, whereas scientific articles and patents are not; AMG largely supports these results, with scientific articles weakly significant at the 10% level. These findings highlight education, digital connectivity, and economic prosperity as more closely linked to human development than formal scientific and innovation output. The study contributes by examining the pillars separately within a single econometric framework for the Arab context, though it is limited by sample size, period, and data availability.
Keywords: knowledge economy; human development; Human Development Index; Arab countries; panel data; CCEMG
Introduction
In recent decades, economic and social growth has been seen as an essential starting point for human development, whose notion has moved from productivity and wealth toward extending human capacities, choices and opportunities. The Human Development Index (HDI), a widely used indicator for comparing countries, combines three dimensions: a long and healthy life, access to knowledge and a reasonable standard of living. Human development thus depends not only on economic resources but also on a society’s ability to develop human talents and provide opportunities to learn from knowledge.
Amid rapid economic and technological transformations, the creation, diffusion and use of knowledge have become crucial to nations’ economic and social capacities. Education, research, innovation, digital communication and access to information are interrelated in contemporary knowledge systems, as the multidimensional Global Knowledge Index reflects (United Nations Development Programme, & Mohammed bin Rashid Al Maktoum Knowledge Foundation, 2025). The indicators selected here are not exhaustive of the knowledge economy but are pillars consistent with the study’s purpose that can be monitored consistently across nations and over the study period.
Each pillar represents a stage in the knowledge process, beginning with human capital. Higher education builds specialised abilities, supports research and innovation, and strengthens the capacity to acquire and use information; the gross enrolment ratio in higher education is therefore an operational measure of one component of human capital development, not a synonym for education or human capital per se.
Building on these skills, information and communication technologies determine how widely knowledge can be accessed. Internet use is a quantitative proxy for the digital environment and may relate to human development by promoting access to educational material, health services and economic possibilities, though this relationship varies with the level of development and the type of technology(Bala, 2024) .
Knowledge also involves generating new knowledge and transforming it into applications and inventions. Resident patent applications measure inventive output, and scientific and technical articles measure the production and dissemination of scientific knowledge; yet patent counts do not always reflect quality or economic and social worth, nor publication counts research quality or developmental impact.
The indicators remain relevant despite these limits, particularly given the significant variations between Arab nations in education, internet connectivity, scientific research and innovation. The Global Knowledge Index emphasises continuing gaps in education, research and development, innovation and digital infrastructure (United Nations Development Programme, & Mohammed bin Rashid Al Maktoum Knowledge Foundation, 2025), making the links between these capacities and human development outcomes an important research issue in the Arab area.
Rapid digital developments also raise the question of whether digital and knowledge infrastructure can turn technical advances into tangible opportunities. The World Human Development Report stresses that technology is not an end in itself; its developmental worth lies in expanding human capacities and choices(United Nations Development Programme, 2025) .
Studying human development in the Arab context therefore requires moving beyond income and growth to directly measurable components of the knowledge system. The study focuses on four interconnected yet distinct indicators: higher-education enrolment (human capital formation); the percentage of internet users (digital penetration and access to knowledge); resident patent applications (technological innovation output); and scientific and technical articles (scientific knowledge production).
The central problem is to examine how far these pillars are linked to human development in Arab countries, and whether the relationships persist after controlling for income. The study tests the relationship between the four indicators and the HDI for a sample of Arab countries during 2010–2022, with per capita GDP as a control variable.
The study starts from the premise that disparities in human development among Arab countries may be partly linked to differences in capacity to build human capital, expand digital access to knowledge, produce technological innovations and generate scientific knowledge. It therefore breaks the knowledge economy down into indicators of different dimensions of the knowledge process rather than a single composite, and examines each one’s relationship to human development within a single econometric model.
The study’s scientific value has three aspects: thematic, combining higher education, the Internet, patents and scientific output in one framework; contextual, focusing on Arab countries that differ in income and in educational, digital and innovative capabilities; and econometric, using balanced panel data for 2010–2022 with estimators that account for cross-sectional dependence and trend heterogeneity, and adjusting for per capita GDP.
Accordingly, the study seeks to answer the following main question:
What is the impact of selected knowledge-economy pillars on human development in a sample of Arab countries during 2010–2022?
This leads to sub-questions about the relationship of higher education enrollment, Internet use, resident patent applications, and scientific and technical articles with the HDI, and whether these relationships persist after controlling for GDP per capita.
Thus, the study provides econometric evidence on the relationship between selected pillars of the knowledge economy and human development in the Arab context, moving from the general concept to testing several components separately and simultaneously, which helps identify the knowledge channels associated with human development; theoretical interpretation remains within the study’s theoretical framework.
- Previous Studies
Interest in knowledge and human development has grown as the literature shifted from viewing knowledge as a driver of economic advancement to a catalyst for developing human potential. Studies have examined education, human capital, information and communication technology (ICT), innovation, and scientific research, with results varying by context, period, and econometric approach.
Benounissa and Benabou (2017) examined Algeria for the period 1990–2007, testing the relationship between human development and knowledge-economy indicators such as education and patents by means of stationarity, correlation and Granger causality tests among early studies. Investment in human resources, knowledge and innovation had supported human development. The study links the knowledge economy with human development in the Arab context, however, the use of only one country, an old period of time, and the absence of modern digital and scientific-output indicators necessitate the use of a multi-country Arab sample.
Parcero and Ryan (2017) broadened the scope by looking at the trajectory of Qatar and UAE towards a knowledge economy, compared to 17 benchmark countries, using indicators of education, ICT, innovation, and economic and institutional environment. They disclosed inconsistencies in building knowledge-economy components and problems in converting knowledge capabilities into economic outputs. However, the study did not test effects on the HDI, which distinguishes the present study’s dependent variable.
Ejemeyovwi et al. (2019) related such capabilities to human development. They analysed 15 countries of the Economic Community of West African States (ECOWAS) for 2004–2014 with fixed- and random-effects models. The results show a positive and significant relationship between Internet use, innovation and human development. The interaction effect is positive and there are differences across countries, which indicates that the effect is not homogeneous. The study supports the inclusion of the Internet and an innovation indicator in human development models, but it is different in region and period and its innovation index does not correspond to resident patent applications.
Zhang and Danish (2019) studied the dynamic association between ICT, human development and growth in Asia and found that ICT diffusion is related to human development and growth. However, their Asian focus and dynamic ICT–growth relationship differ from the current design which integrates the Internet, higher education, patents and scientific output for an Arab sample.
More recent studies have broadened the digital agenda towards sustainability: Onuoha et al. (2023) analysed ICT and development in ECOWAS using panel cointegration analysis and Verma et al. (2023) studied ICT diffusion in sustainable human development in South Asia. Both emphasise the importance of the digital environment, but their results of sustainable (human) development make them difficult to compare with the HDI of the present study.
Çetin (2024) turned to innovation, finding an association between some innovation and human capital indicators and the HDI in a group of EU countries, while some indicators of research and development were not significant, which highlights the need to distinguish inputs from outputs of knowledge activity. Similarly, Bala (2024) studied 180 countries for the period of 2010–2017 and concluded that the relationship between digital connectivity and human development is context-dependent in terms of the level of development and type of technology, with mobile broadband and some education and health dimensions being particularly important in developing countries. This allows for specific digital indicators rather than a single ICT block.
Mahfudj and Aisyah (2025) investigated the effect of digitalisation, education, income, economic growth, and renewable energy consumption on the HDI in seven ASEAN countries during the period 2015–2022, using panel data and a fixed-effects model. The index was found to be positively related to internet use, education and some economic variables. The study supports the inclusion of the Internet in the current model, but differs in region and sample and adds other economic and environmental variables.
In a similar fixed-effects approach, Daghagh Yazd et al. (2025) studied the effects of technology, education, research and development and the environment on HDI in 27 European countries (2007-2020) by assuming that human development is influenced by the combined technological, educational and research capacities and that the relationship between the components is not necessarily equal. But the European context is not that of the Arab world. Their model is much more encompassing of the environmental and technological factors.
Dahmani and Mabrouki (2025) applied a CS-ARDL model to examine human capital, innovation, governance, and economic growth in resource-rich and resource-poor economies in the Arab and Middle East and North Africa (MENA) region, where the HDI is rarely the dependent variable, over 1996–2020, highlighting the significance of capital, labour, and innovation, with group differences. Derbal et al (2025). investigated governance, foreign direct investment, human capital, and growth in 14 Arab countries over the period 2002–2017 using dynamic panel models. Both emphasise human capital, innovation and institutional differences, but their outcome is economic growth, not the HDI, and they do not explore higher education, the Internet, patents and scientific output jointly.
More recently, Kumari (2026) investigated the role of ICT components in promoting human development in the BRICS countries using panel data for the period 2000–2021, and found a positive association with varying importance across components, implying that disaggregation of the technological dimension is more informative. Digital growth and human development in eight Organisation for Economic Co-operation and Development (OECD) countries for the period 2015–2023 were examined by Oduniyi and Adu (2026) using panel data and a fixed-effects model that distinguished between the pre- and post-COVID-19 periods. They emphasise the inclusion of recent digital transformations in explaining HDI trends. But they stay within the OECD context and do not consider higher education, Internet, patents and scientific output together.
First, there has been a shift in the literature from general treatments to tests of specific components. Second, the relationship is not homogenous: in several studies the Internet, innovation, education and human capital are associated with human development, but the strength varies with context, period and indicator. Third, some studies use economic growth or sustainable development as the outcome instead of the HDI.
These patterns exhibit three gaps. Then, the studies that have simultaneously examined higher education enrolment, Internet use, resident patent applications and scientific and technical articles as pillars explaining the HDI in an Arab panel are limited. Second, many previous studies use fixed- or random-effects models, which usually assume homogeneity of slopes. Third, much of the evidence is on non-Arab regions or non-HDI outcomes. Hence, the research gap is a unified test of the four pillars on eight Arab countries (Algeria, Egypt, Morocco, Tunisia, Saudi Arabia, Jordan, the UAE and Qatar) for the period 2010–2022, using panel estimators that take into account cross-sectional dependence and slope heterogeneity, with GDP per capita as a control variable.
The contribution of this study therefore is not to claim that each sub-relationship is unexplored, but rather to integrate the four knowledge dimensions in a single econometric framework in the Arab context and test their relationship to the HDI while accounting for cross-sectional dependence and cross-country variation.
In the next section, the theoretical rationale for the relevance of the four pillars to human development is presented.
2. Theoretical Framework
2.1 The Knowledge Economy: Concept and Selected Pillars
The knowledge economy explains contemporary developmental transformations as economies shift from physical capital and natural resources toward knowledge, skills, research, innovation, and digital infrastructure. Knowledge accumulates through education and research, spreads through communication networks, and is applied through innovation (Parcero & Ryan, 2017; United Nations Development Programme, & Mohammed bin Rashid Al Maktoum Knowledge Foundation, 2025). The Global Knowledge Index spans education, research and development and innovation, ICT, the economy, and governance(United Nations Development Programme, & Mohammed bin Rashid Al Maktoum Knowledge Foundation, 2025), so it is not a single index.
The study therefore selects four pillars representing interconnected stages of the knowledge process, consistent with the literature’s use of specific digital components(Bala, 2024; Kumari, 2026) and the link between education, patents, and human development in the Arab context (Benounissa & Benabou, 2017); they do not cover all dimensions.
Higher education (TER) forms advanced human capital through specialized skills, research, and knowledge transfer (World Bank, 2026; Zhao et al., 2025), and is a key determinant of human development (Benounissa & Benabou, 2017; Çetin, 2024; Mahfudj & Aisyah, 2025) . The gross enrollment ratio measures participation, not quality.
The Internet (INT), the digital dimension, provides access to information, services, and education, and is measured by the percentage of individuals using it, not all ICT components. It relates to human development through education, health, and income (Bala, 2024; Ejemeyovwi et al., 2019), and is treated as intertwined with growth or part of the digital environment (Onuoha et al., 2023; Verma et al., 2023; Zhang & Danish, 2019) .
Innovation (PAT) is where knowledge moves from production to application. Resident patent applications proxy one output, not its quality or value. This rests on distinguishing inputs from outputs, since more spending or research does not automatically yield human development (Çetin, 2024), and on treating innovation and digitalization as interacting (Ejemeyovwi et al., 2019) .
Scientific output (STA) is a national system’s capacity to generate and disseminate scientific knowledge, measured by published scientific and technical articles, an indicator of volume, not quality (Daghagh Yazd et al., 2025)
2.2 Theoretical Foundations of the Relationship Between the Knowledge-Economy Pillars and Human Development
These perspectives are integrated, none sufficient alone, consistent with viewing human development as shaped by combined technological, educational, and research capabilities (Daghagh Yazd et al., 2025; Mahfudj & Aisyah, 2025).
Human capital theory treats education and training as an investment in capabilities. Higher education is a primary channel for specialized human capital (Word Bank, 2026; Benounissa & Benabou, 2017; Çetin, 2024), so broader participation is expected to accompany higher human development, though strength varies with education quality and skills relevance.
Endogenous growth theory extends this to the whole economy through the role of knowledge, human capital, and research and development in generating growth, and Arab and MENA studies use it to combine human capital, innovation, and governance (Dahmani & Mabrouki, 2025; Derbal et al., 2025). It also explains the relationship among higher education, scientific output, and innovation. Because knowledge accumulates, effects are gradual, long-term, and contingent on institutions’ ability to apply knowledge (Parcero & Ryan, 2017) .
Innovation theory addresses what growth theory leaves open, the transformation of knowledge into technologies, products, and solutions, building on the input–output distinction (Çetin, 2024) and the challenge of converting knowledge capabilities into economic outputs(Parcero & Ryan, 2017). Higher education and scientific output supply what innovation needs, forming a chain from human capital to knowledge, innovation, and improved capabilities (Ejemeyovwi et al., 2019) .
The capabilities perspective supplies the normative anchor for these instrumental perspectives: human development as expanding capabilities and choices, not merely rising income (United Nations Development Programme, & Mohammed bin Rashid Al Maktoum Knowledge Foundation, 2025). Improvement is not automatic and requires a supportive institutional, educational, and digital environment (Parcero & Ryan, 2017; United Nations Development Programme, & Mohammed bin Rashid Al Maktoum Knowledge Foundation, 2025)
2.3 Human Development and Its Measurement
Human development expands the choices and capabilities that enable individuals to lead healthy lives, acquire knowledge, and enjoy a decent standard of living, differing from economic development, which focuses on income and production. Studies differ by outcome: the HDI (Çetin, 2024; Daghagh Yazd et al., 2025; Mahfudj & Aisyah, 2025), economic growth (Dahmani & Mabrouki, 2025; Derbal et al., 2025), or sustainable (human) development (Onuoha et al., 2023; Verma et al., 2023).
The HDI is an operational composite index from zero to one measuring average achievement in health, knowledge (mean and expected years of schooling), and standard of living (gross national income per capita; UNDP, 2025b). It does not capture inequality, poverty, human security, or empowerment.
Two explanatory variables partly overlap with the HDI. Higher education enrollment is not an HDI component, but its link to the education dimension may make its coefficient partly mechanical. GDP per capita in current U.S. dollars controls for the economic level and correlates strongly with the HDI, so its coefficient is a control, not an independent effect of knowledge(Mahfudj & Aisyah, 2025; Zhang & Danish, 2019) .
2.4 The Theoretical Relationship Between the Knowledge Pillars and Human Development
The pillars form one chain from building capabilities and accessing and producing knowledge, to applying it, and finally to expanded opportunities and capabilities:
- Higher education → human capital and skills formation
- Internet → access to and exchange of knowledge and services
- Scientific output → generation, accumulation, and dissemination of knowledge
- Patents → conversion of part of knowledge into innovative outputs
- Knowledge pillars → expanded opportunities and capabilities → potential improvement in human development
Its strength depends on the type of technology and the level of development (Bala, 2024); ICT components play different roles (Kumari, 2026); recent digital transformations call for explicit inclusion(Oduniyi & Adu, 2026); and knowledge infrastructure does not guarantee proportionate outcomes (Parcero & Ryan, 2017).
The relationship is influenced by the economic and institutional environment (Dahmani & Mabrouki, 2025; Derbal et al., 2025), with two design implications. First, its strength may vary across countries with institutional conditions and income, calling for estimators that allow country-specific slopes. Second, countries share unobserved common factors, calling for estimators that account for cross-sectional dependence; both underline the value of panel data.
Because the pillars accumulate over time, the relationship is treated as long-term, requiring stationarity and cointegration checks. Patents, articles, and GDP per capita are logged because their scales vary widely, so their coefficients reflect relative changes, while TER and INT coefficients are in percentage points.
Coefficients are partial, conditional effects, not definitive causal relationships, as reciprocal influence cannot be ruled out. The study does not assume uniform effects: each pillar operates through a different mechanism, and testing them in one model using the average of country-specific coefficients shows whether their association with human development differs after adjusting for income.
The next section translates these expectations into testable hypotheses and an econometric specification.
3.METHOLOGIE
3.1 Data Sources, Variables and Data Treatment
The empirical analysis draws on a balanced panel of eight Arab countries — Algeria, Egypt, Jordan, Morocco, Qatar, Saudi Arabia, Tunisia, and the United Arab Emirates — covering 2010–2022. Data for the explanatory variables are obtained from the World Bank’s World Development Indicators (WDI) database; HDI is obtained from the UNDP Human Development Reports. The country sample and study period were determined by the availability and comparability of the required indicators across the selected countries.
The dependent variable is the Human Development Index, while the explanatory variables include tertiary education enrollment, Internet use, patent applications by residents, and scientific and technical journal articles. GDP per capita is included as a control variable to account for differences in economic development across the countries. The definitions, indicators, and measurement units of the variables are presented in Table 01.
Table-01- Variable definitions and sources
| Variable | Symbol | Definition | Source | Code | Measurement |
| Human Development Index | HDI | Composite index of health, education, and income dimensions of human development | UNDP | — | Index (0–1) |
| Tertiary education enrollment | TER | Gross enrollment ratio, tertiary education | WDI | SE.TER.ENRR | % |
| Internet use | INT | Share of individuals using the Internet | WDI | IT.NET.USER.ZS | % |
| Patent applications | PAT | Patent applications filed by residents | WDI | IP.PAT.RESD | Number |
| Scientific and technical articles | STA | Scientific and technical journal articles published | WDI | IP.JRN.ARTC.SC | Number |
| GDP per capita | GDPpc | Gross domestic product divided by midyear population | WDI | NY.GDP.PCAP.CD | Current US$ |
Source: World Bank (Bank), World Development Indicators (WDI); UNDP, Human Development Reports ( Human Development Reports, 2025).
To ensure a balanced panel, missing observations were examined by country and variable. The limited missing values were estimated using each country’s historical average growth rate calculated from the available observations for the respective variable. This procedure resulted in a complete dataset of 104 country-year observations (8 countries × 13 years) covering the period 2010–2022.
3.2 Model Specification
To examine the effect of the selected knowledge-economy pillars on human development, the study specifies a panel-data model in which the Human Development Index is related to tertiary education enrollment, Internet use, patent applications, scientific and technical journal articles, and GDP per capita. The general functional form is expressed as follows:

Given the substantial differences in scale and distribution across the variables measured in absolute values, PAT, STA, and GDP per capita are transformed into their natural logarithms. This transformation helps reduce the influence of extreme observations, mitigate skewness, and improve the comparability of variables with substantially different scales. In contrast, HDI, TER, and INT are retained in their original forms because their measurement scales and distributions do not require logarithmic transformation. Accordingly, the empirical model is specified as:

where i denotes the country and t denotes the year, αi represents the country-specific intercept, and εit denotes the error term. The coefficients measure the partial effect of each explanatory variable on human development, conditional on the other variables included in the model.
3.3 Cross-Sectional Dependence Test
Given the cross-country nature of the panel dataset, the analysis first examines whether the countries are interdependent through common shocks, international linkages, or other unobserved factors. Ignoring cross-sectional dependence may lead to biased inference and may affect the validity of conventional first-generation panel tests. Therefore, the (Pesaran, 2004) Cross-Sectional Dependence (CD) test is employed to assess whether the disturbances are correlated across cross-sectional units. Unlike the earlier (Breusch & Pagan, 1980) LM test, which is more appropriate when the time dimension is sufficiently large relative to the cross-sectional dimension, the Pesaran CD test is applicable to panels with relatively small-time dimensions and exhibits satisfactory size and power properties in small samples. These properties make it suitable for the present panel, which consists of 8 countries (N = 8) observed over 13 years (T = 13).
The Pesaran CD statistic is based on the average of the pairwise correlation coefficients of the residuals obtained from the individual country regressions and can be expressed as:

where N denotes the number of cross-sectional units, T represents the number of time periods, and is the pairwise correlation coefficient of the residuals between countries i and j.
The null hypothesis assumes cross-sectional independence , whereas the alternative hypothesis indicates the presence of cross-sectional dependence among the panel units. A statistically significant CD statistic therefore provides evidence against cross-sectional independence. The outcome of this test also guides the subsequent econometric strategy, particularly the use of second-generation panel unit-root and estimation techniques that account for cross-sectional dependence.
3.4 Slope Homogeneity Test
In addition to cross-sectional dependence, it is necessary to determine whether the slope coefficients linking the explanatory variables to HDI are homogeneous across countries, since institutional, economic, and human-capital differences may cause these relationships to vary from one country to another.
This is assessed using the (Pesaran M. H., 2008) test, a standardized version of (Swamy, 1970) dispersion statistic measuring the extent to which country-specific slope estimates deviate from the pooled estimator:


where N is the number of cross-sectional units, T the time dimension, k the number of regressors, and S̃ the dispersion of the individual slope estimates around the pooled estimator; Δ̃_adj replaces the asymptotic variance (2k) with its exact finite-sample counterpart.


Rejection of H0 indicates slope heterogeneity across countries.
This test matters for selecting an appropriate estimator: imposing common slopes on a heterogeneous panel would conceal country-specific relationships and lead to misleading inference. Together with the cross-sectional dependence test, its results guide the choice of estimators that accommodate both heterogeneity and CSD.
3.5 Second-Generation Panel Unit Root Tests
Given the cross-sectional dependence established in Section 3.3, conventional first-generation panel unit-root tests would yield unreliable results here. The study therefore employs (Pesaran M. H., 2007) Cross-sectionally Augmented Dickey–Fuller (CADF) and Cross-sectionally Augmented IPS (CIPS) tests, which remain valid under cross-sectional dependence by incorporating cross-sectional averages into each country’s unit-root regression.
The CADF regression for each country, and the CIPS statistic obtained by averaging the individual CADF t-ratios across countries, are expressed as:


where and
denote the cross-sectional averages of the lagged level and first difference of the variable, respectively, while
is the t-ratio associated with
in the individual CADF regression. Each variable is tested both at level and at first difference to determine its order of integration.
Unlike first-generation, homogeneous panel unit-root tests, CIPS allows the autoregressive coefficient to differ across countries: The hypotheses are therefore specified as:


Thus, the null hypothesis indicates the presence of a unit root in every cross-sectional unit, whereas the alternative allows the autoregressive coefficient to be negative—and hence the series to be stationary—for at least some countries. Rejection of provides evidence against the panel-wide unit-root hypothesis and supports stationarity for at least part of the panel.
3.6 Panel Cointegration Test
Since Section 3.5 establishes a mixed order of integration among the variables, the next step is to test whether the I(1) series are cointegrated and share a stable long-run relationship. This is examined using Westerlund’s (2005) variance-ratio test, applied to cross-sectionally demeaned data to account for the dependence established in Section 3.3.

where are the residuals from the candidate cointegrating regression and
.
The test evaluates the null hypothesis of no cointegration (H0) against the alternative hypothesis that cointegration exists in at least some cross-sectional units (H1). If H0 is rejected, the estimates reported in Section 3.7 can be interpreted as reflecting a long-run equilibrium relationship.
3.7. CCEMG Estimation
Given the evidence of cross-sectional dependence and slope heterogeneity established in the preceding sections, the study employs the Common Correlated Effects Mean Group (CCEMG) estimator proposed by (Pesaran M. H., 2006). The CCEMG approach is designed to account for unobserved common factors that may generate cross-sectional dependence by augmenting the country-specific regressions with cross-sectional averages of the dependent and explanatory variables. It also allows the slope coefficients to differ across countries, making it suitable for heterogeneous panels.
The estimated country-specific model can be expressed as:

Where represents human development, while
and
denote tertiary education enrollment, the logarithm of GDP per capita, the logarithm of scientific and technical articles, the logarithm of resident patent applications, and Internet use, respectively. The vector
contains the cross-sectional averages of the dependent and explanatory variables, which serve as proxies for unobserved common factors.
The CCEMG estimator is obtained by estimating the augmented regression separately for each country and then calculating the arithmetic mean of the country-specific slope coefficients:
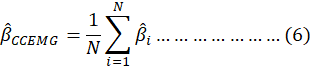
This specification allows the effects of the knowledge-economy pillars on human development to vary across countries while controlling for common shocks and unobserved factors that affect the countries simultaneously.
3.8. AMG Estimation and Robustness Check
The Mean Group (MG) estimator of (Pesaran M. H., 1995) allows slope coefficients to vary across countries. Building on this framework, the Augmented Mean Group (AMG) estimator incorporates a common dynamic process to account for unobserved common factors and cross-sectional dependence (Eberhardt M. &., 2010; Eberhardt M. , 2012).
AMG is estimated in two stages. First, a pooled first-difference regression with year dummies is used to obtain the common dynamic process. Second, this process is included in each country-specific regression, and the resulting coefficients are averaged across countries:

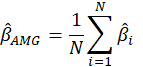
Where denotes the common dynamic process and
the country-specific loading.
The AMG estimates provide a robustness check for the CCEMG results reported in Section 3.7; their comparison is presented in Section 4.7.
4.1 Descriptive Statistics
Table 02 reports the descriptive statistics for the variables entering the model specified above, offering a first view of the panel’s central tendency and dispersion before turning to the second-generation diagnostic tests.
Table -02- Descriptive statistics
| Variable | Obs. | Mean | Std. Dev. | Min | Max |
| HDI | 104 | 0.772 | 0.078 | 0.607 | 0.921 |
| TER | 104 | 37.524 | 14.532 | 9.643 | 77.966 |
| LnGDPpc | 104 | 9.182 | 1.256 | 7.781 | 11.594 |
| LnSTA | 104 | 8.268 | 0.850 | 5.992 | 10.159 |
| LnPAT | 104 | 4.807 | 1.518 | 0.000 | 7.316 |
| INT | 104 | 65.086 | 24.283 | 12.500 | 100.000 |
Note: N = 104 (8 countries × 13 years, 2010–2022, balanced panel). GDPpc, STA, and PAT enter the model in natural-logarithmic form.
Source: Author’s calculations based on Stata 17 estimates.
The panel is balanced, with 104 country-year observations covering eight Arab economies. Average human development stands at 0.772, within the UNDP’s “high” band, yet the range — 0.607 to 0.921 — spans from the medium- to the very-high-development tier, pointing to a sample of distinct development trajectories rather than a homogeneous bloc. The same pattern appears more sharply in the economic and infrastructural variables: GDP per capita ranges from 7.78 to 11.59 in logs (roughly $2,400 to $108,500 in levels), and internet penetration from 12.5% to full coverage — gaps wide enough to place low-income diversified economies and hydrocarbon-rich Gulf states within the same panel.
The knowledge-related variables show a comparable but more uneven pattern. Tertiary enrollment ranges from under 10% to almost 78%, while scientific output (lnSTA) is comparatively concentrated around a mean of 8.27. Patents are the clearest outlier: the minimum value of lnPAT is exactly zero — a single patent application in at least one country-year — against a maximum equivalent to over 1,500. This heterogeneity, combined with the close economic and structural ties among the sampled countries, motivates the cross-sectional dependence and slope-homogeneity tests reported next.
4.2 Cross-Sectional Dependence (Pesaran CD Test)
Before proceeding to unit-root and cointegration testing, it is necessary to establish whether the panel exhibits cross-sectional dependence (CSD), since first-generation panel techniques assume independence across units — an assumption unlikely to hold among economically and structurally linked countries. This is assessed using Pesaran’s (2004) CD test, applied to each variable individually.
Table -03- Pesaran CD test for cross-sectional dependence
| Variable | CD-statistic | p-value | Decision |
| HDI | 17.10 | 0.000 | CSD present |
| TER | 4.66 | 0.000 | CSD present |
| lnGDPpc | 6.51 | 0.000 | CSD present |
| lnSTA | 17.53 | 0.000 | CSD present |
| lnPAT | 5.80 | 0.000 | CSD present |
| INT | 17.30 | 0.000 | CSD present |
Note: H0: cross-sectional independence. The CD statistic is asymptotically distributed as N(0,1) under H0.
Source: Author’s calculations based on Stata 17 estimates.
The null hypothesis of cross-sectional independence is rejected at the 1% level for every variable in the model, with CD statistics ranging from 4.66 (TER) to 17.53 (lnSTA). This is an unambiguous result: human development, tertiary enrollment, income, scientific output, patenting, and internet access all move together across the eight countries to a degree that cannot be attributed to chance. Substantively, this is consistent with the strong regional and economic ties linking these economies — shared exposure to oil-price cycles, regional trade and labour mobility, and common global shocks such as the 2008–09 financial crisis and the COVID-19 pandemic. Methodologically, the finding rules out first-generation panel unit-root and cointegration tests, which assume cross-sectional independence and would yield biased inference here, and instead justifies the cross-sectionally augmented approach (CIPS/CADF, Westerlund, CCEMG) adopted throughout the rest of the analysis.
4.3 Slope Homogeneity (Pesaran–Yamagata Test)
The cross-sectional dependence detected above raises a related question: does the relationship between the knowledge pillars and human development take the same form in every country, or does it vary with each economy’s structure? Pesaran and Yamagata’s (2008) test addresses this directly, setting the null hypothesis of homogeneous slope coefficients across the panel against the alternative that they differ from one country to another.
Table -04- Pesaran–Yamagata slope homogeneity test
| Test | Statistic | p-value | Decision (5%) |
| Delta (Δ̃) | 3.918 | 0.000 | Reject H₀ |
| Adjusted Delta (Δ̃adj) | 5.767 | 0.000 | Reject H₀ |
Note: H0: slope coefficients are homogeneous across cross-sectional units.
Both statistics reject the null of slope homogeneity well beyond the 1% level, and the adjusted version — more reliable in finite samples — points to the same conclusion even more strongly. In practical terms, the effect of tertiary education, income, scientific output, patenting, and internet access on human development is not uniform across Algeria, Egypt, Morocco, Tunisia, Jordan, Saudi Arabia, the UAE, and Qatar: each economy appears to convert these knowledge inputs into human development at its own pace and intensity. Combined with the cross-sectional dependence already established, this rules out pooled estimators that impose a common slope on the panel and confirms that a heterogeneous, cross-sectionally augmented approach — CIPS/CADF, Westerlund, and CCEMG — is the appropriate route for the rest of the analysis.
4.4 Panel Unit Root Tests (CIPS/CADF)
Because cross-sectional dependence has already been confirmed for every variable, first-generation unit-root tests such as Levin–Lin–Chu or the standard Im–Pesaran–Shin procedure cannot be relied on here, since both assume independence across countries. Pesaran’s (2007) CIPS test, built on cross-sectionally augmented Dickey–Fuller (CADF) regressions, corrects for this by purging the common factors behind the cross-sectional dependence before testing for a unit root, and is applied to each variable at level and at first difference.
Table -05-CIPS panel unit root test
| Variable | CIPS (level) | Decision | CIPS (first difference) | Decision | Order of integration |
| HDI | −1.782 | Non-stationary | −3.287*** | Stationary | I(1) |
| TER | −1.240 | Non-stationary | −2.386** | Stationary | I(1) |
| LnGDPpc | −1.252 | Non-stationary | −2.526** | Stationary | I(1) |
| LnSTA | −1.792 | Non-stationary | −2.456** | Stationary | I(1) |
| LnPAT | −2.564** | Stationary | −3.696*** | Stationary | I(0) |
| INT | −2.049 | Non-stationary | −2.288** | Stationary | I(1) |
Note: ** significant at 5%; *** significant at 1%. H0: series contains a unit root.
With one exception, every variable in the model follows the same pattern: human development, tertiary enrollment, income, scientific output, and internet access are all non-stationary in levels but become stationary once first-differenced, placing them at I(1). Patents break that pattern — lnPAT already rejects the unit-root null at level, making it stationary in its own right, i.e., I(0).
This leaves the panel with a mixed order of integration rather than a single common one. Importantly, no variable requires second-differencing to achieve stationarity, which keeps the analysis within reach of the cointegration and CCE-based techniques used below. Still, the presence of an I(0) series alongside five I(1) series is worth keeping in mind, since this kind of mixed integration structure is precisely what tends to complicate a clean cointegrating relationship among the variables — a point that becomes directly relevant once the Westerlund test is examined next.
4.5 Panel Cointegration Test (Westerlund)
Having established a mixed order of integration across the panel — lnPAT stationary in levels, the remaining five variables stationary only after first-differencing — the next step is to test whether the I(1) variables nonetheless share a common long-run path. This is examined using Westerlund’s (2005) variance-ratio test, applied here to cross-sectionally demeaned data, consistent with the cross-sectional dependence already documented in Section 4.2.
Table -06- Westerlund panel cointegration test
| Test | Statistic | p-value | Decision (5%) | Result |
| Variance Ratio (demeaned) | 0.5796 | 0.2811 | Fail to reject H₀ | No cointegration |
Note: H0: no cointegration among the panel variables (Westerlund 2005, cross-sectionally demeaned).
The variance-ratio statistic is far from significant (p = 0.281), so the null hypothesis of no cointegration cannot be rejected at the 5% level. The data therefore offer no statistical support for a stable, error-correcting long-run relationship linking HDI to tertiary enrollment, income, scientific output, patents, and internet access as a system.
This result shapes how every estimate in the sections that follow must be read. With cointegration not established, the coefficients produced by CCEMG, MG, and AMG cannot be presented as a proven long-run equilibrium relationship in the strict time-series sense — doing so would claim more than this test supports. What these estimators do provide, and what they are used for here, is the average relationship between the knowledge-related regressors and human development across a panel that is both heterogeneous and cross-sectionally dependent, net of unobserved common factors. Accordingly, the CCEMG, MG, and AMG coefficients discussed next are read as robust average associations across the eight countries and thirteen years of the sample, not as evidence of a cointegrated long-run equilibrium.
4.6 Main Estimation: Common Correlated Effects Mean Group (CCEMG)
With cross-sectional dependence, slope heterogeneity, and a mixed order of integration all confirmed, and no cointegrating relationship established in Section 4.5, the average relationship between the knowledge pillars and human development is estimated using the Common Correlated Effects Mean Group estimator (Pesaran, 2006). CCEMG augments each country-specific regression with cross-sectional averages of the dependent and independent variables, which filters out unobserved common factors, before averaging the resulting country-specific slopes into a single panel-wide coefficient.
Table -07-CCEMG estimation results
| Variable | Coefficient | p-value | Significance |
| TER | 0.0021 | 0.043 | Significant at 5% |
| lnGDPpc | 0.0814 | 0.009 | Significant at 1% |
| lnSTA | 0.0211 | 0.299 | Not significant |
| lnPAT | 0.0084 | 0.327 | Not significant |
| INT | 0.0005 | 0.039 | Significant at 5% |
Note: Dependent variable: HDI. CCEMG = Common Correlated Effects Mean Group (Pesaran, 2006).
Source: Author’s calculations based on Stata 17 estimates (CCEMG).
Three of the five knowledge-related variables carry a statistically meaningful coefficient. Tertiary enrollment is significant at the 5% level (p = 0.043): a 10-percentage-point rise in enrollment is associated with an average increase of roughly 0.021 points in the HDI, other pillars held constant. Income is the most strongly significant variable in the model (p = 0.009): a 10% increase in GDP per capita corresponds to an average gain of about 0.008 points in HDI. Internet penetration is significant at 5% as well (p = 0.039), with a 10-percentage-point increase in usage associated with an average rise of roughly 0.006 points in HDI.
Scientific output and patenting activity, by contrast, are not significant at conventional levels (p = 0.299 and p = 0.327). Both carry the expected positive sign, so the direction of the relationship matches theoretical priors, but the estimated average association is too imprecise to be distinguished from zero across this particular panel. This is not entirely surprising in light of Table 1: patenting activity was shown to be extremely uneven across the sample, with some country-years recording as little as a single patent, which can flatten a mean-group average even if a stronger link exists in the panel’s more research-intensive economies.
As established in Section 4.5, the absence of confirmed cointegration means these coefficients are not read as long-run equilibrium effects. They represent the average association between each knowledge pillar and human development across the eight countries and thirteen years of the panel, net of cross-sectional dependence and slope heterogeneity — evidence that education, income, and connectivity track human development fairly closely in this sample, while the link with formal scientific and innovation output is comparatively weak and imprecisely estimated.
4.7 Robustness Check: Augmented Mean Group (AMG)
As a further robustness check, the model is re-estimated using the Augmented Mean Group estimator (Bond & Eberhardt, 2009; Eberhardt & Teal, 2010), which handles cross-sectional dependence through a different route than CCEMG: rather than augmenting each equation with cross-sectional averages of the variables, AMG extracts a single common dynamic process from the pooled, first-differenced time dummies and includes it as an additional regressor in every country’s equation before averaging the resulting slopes.
Table -08- AMG estimation results
| Variable | Coefficient | p-value | Significance |
| TER | 0.00294 | 0.040 | Significant at 5% |
| LnGDPpc | 0.07596 | 0.012 | Significant at 5% |
| LnSTA | 0.01899 | 0.095 | Significant at 10% |
| LnPAT | 0.00751 | 0.791 | Not significant |
| INT | 0.00011 | 0.036 | Significant at 5% |
| Common Dynamic Process | 0.99582 | 0.000 | Significant at 1% |
| Constant | 0.61277 | 0.000 | Significant at 1% |
Note: Dependent variable: HDI. Wald χ²(5) = 21.68, p = 0.0006 (joint significance of the five pillars). RMSE (σ) = 0.0027. AMG = Augmented Mean Group.
Source: Author’s calculations based on Stata 17 estimates (AMG).
The AMG estimates provide substantial support for the main CCEMG results, particularly regarding the positive and statistically significant effects of tertiary education, GDP per capita, and Internet use. TER has a positive and statistically significant coefficient of 0.00294 (p = 0.040), while lnGDPpc is positive and significant at the 5% level (coefficient = 0.07596, p = 0.012). Similarly, INT has a positive and statistically significant coefficient of 0.00011 (p = 0.036), consistent with the positive effect identified under CCEMG. The coefficient of lnSTA is also positive (0.01899) and statistically significant at the 10% level (p = 0.095), providing evidence of a positive association between scientific and technical publications and human development. In contrast, lnPAT remains statistically insignificant (coefficient = 0.00751, p = 0.791).
The common dynamic process is positive and highly statistically significant (coefficient = 0.99582, p = 0.000), indicating the presence of a strong common dynamic component across the countries in the sample. Its inclusion in the AMG specification captures unobserved common factors and shared temporal dynamics that may affect human development across the countries.
Overall, the AMG results provide substantial robustness to the main CCEMG findings. The positive and statistically significant effects of TER, lnGDPpc, and INT are consistent across both estimators, while lnSTA is additionally significant at the 10% level under AMG. By contrast, lnPAT remains statistically insignificant under both approaches. These findings indicate a relatively stable positive association between tertiary education, economic development, Internet use, and human development, whereas the evidence for resident patent applications remains statistically inconclusive across the two estimators.
5. Conclusion
This study examined the role of knowledge economy pillars in promoting sustainable human development in eight Arab countries over the period 2010–2022, using panel data and second-generation econometric techniques to account for cross-sectional dependence and heterogeneity.
The empirical results obtained from the CCEMG estimator indicate that higher education enrollment, GDP per capita, and Internet use are positively and statistically significantly associated with human development. In contrast, scientific and technical publications and resident patent applications do not exhibit statistically significant effects at conventional levels. The AMG estimates largely support these findings, although scientific and technical publications become weakly significant at the 10% level. The consistency of the main results across the two estimators highlights the importance of education, digital connectivity, and economic prosperity in supporting human development in the selected countries.
These findings suggest that Arab countries should strengthen access to and the quality of higher education, expand digital infrastructure and Internet access, and promote inclusive economic growth. Greater efforts are also needed to translate scientific research and patent activity into practical innovations that contribute to improvements in human well-being.
This study is subject to limitations related to the number of countries, the observation period, and the availability of data. Moreover, the cointegration test does not provide sufficient evidence of a long-run equilibrium relationship among the variables. Future research could therefore extend the country sample and observation period, explore alternative indicators of the knowledge economy, and apply additional estimation approaches to examine the robustness of the findings.
References
Bala, P. (2024). The impact of mobile broadband and internet bandwidth on human development—A comparative analysis of developing and developed countries. Journal of the Knowledge Economy, 15(4), 16419–16453. https://doi.org/10.1007/s13132-023-01711-0.
Breusch, T. S., & Pagan, A. R. (1980). The Lagrange multiplier test and its applications to model specification in econometrics. The Review of Economic Studies, 47(1), 239–253.
Benounissa, L., & Benabou, D. (2017). Impact of knowledge economy on human development (Case of Algeria from 1990 to 2007. Revue Algérienne Des Ressources Humaines, 1(2), 54–63. https://doi.org/https://asjp.cerist.dz/en/downArticle/139/1/2/60640
Breusch, T. S., & Pagan, A. R. (1980). The Lagrange multiplier test and its applications to model specification in econometrics. The Review of Economic Studies, 47(1), 239–253.
Çetin, M. (2024). Innovation, global competitiveness and human development index: EU cluster case. Istanbul Gelisim University Journal of Social Sciences, 11(2), 559–574. https://doi.org/10.17336/igusbd.1318161
Daghagh Yazd, S., Pekin Alakoç, N., & Oroszlányová, M. (2025). Exploring the influence of high-technology and environmental factors on human development index: A longitudinal investigation. Cogent Social Sciences, 11(1). https://doi.org/10.1080/23311886.2025.2473642
Dahmani, M., & Mabrouki, M. (2025). Human capital, innovation, governance and economic growth in resource-rich and resource-poor MENA countries: New evidence from the CS-ARDL approach. Journal of the Knowledge Economy, 16(5), 16152–16186. https://doi.org/10.1007/s13132-024-02408-8
Derbal, A., Lakhdar, A., Souar, Y., & Zirari, B. (2025). The impact of governance and the interaction between FDI and human capital on economic growth in Arab countries: A dynamic panel data analysis. Journal of the Knowledge Economy, 16(5), 16942–16965. https://doi.org/10.1007/s13132-024-02353-6.
Eberhardt, M. (2012). Estimating panel time-series models with heterogeneous slopes. The Stata Journal, 12(1), 61–71.
Eberhardt, M., & Teal, F. (2010). Productivity analysis in global manufacturing production. University of Oxford, Department of Economics.
Ejemeyovwi, J. O., Osabuohien, E. S., Johnson, O. D., & Bowale, E. I. K. (2019). Internet usage, innovation and human development nexus in Africa: The case of ECOWAS. Economic Structures, 8, Article 15. https://doi.org/10.1186/s40008-019-0146-2
Kumari, N. (2026). Tech-fueled human development: Role of ICT in enhancing human development—A panel analysis. Journal of Economic Studies, 53(3), 628–646. https://doi.org/10.1108/JES-11-2024-0742
Mahfudj, A., & Aisyah, S. (2025). The impact of digitalization on the Human Development Index in ASEAN. Indonesian Interdisciplinary Journal of Sharia Economics, 8(3), 7615–7625. https://doi.org/10.31538/iijse.v8i3.7205
Oduniyi, O. S., & Adu, D. (2026). The impact of digital growth on human development in selected OECD countries. Discover Sustainability. https://doi.org/10.1007/s43621-026-03490-5
Onuoha, F. C., Uzoechina, B. I., Emekaraonye, C. F., Ochuba, O. I., & Inyang, N. F. (2023). Information and communication technologies and sustainable development in ECOWAS subregion: Evidence from a panel cointegration analysis. Managerial and Decision Economics, 44(2), 787–806. https://doi.org/10.1002/mde.3712
Parcero, O. J., & Ryan, J. C. (2017). Becoming a knowledge economy: The case of Qatar, UAE, and 17 benchmark countries. Journal of the Knowledge Economy, 8(4), 1146–1173. https://doi.org/10.1007/s13132-016-0355-y.
Pesaran, M. H. (2007). A simple panel unit root test in the presence of cross-section dependence. Journal of Applied Econometrics, 22(2), 265–312. https://doi.org/10.1002/jae.951.
Pesaran, M. H., & Yamagata, T. (2008). Testing slope homogeneity in large panels. Journal of Econometrics, 142(1), 50–93. https://doi.org/10.1016/j.jeconom.2007.05.010.
Pesaran, M. H., & Smith, L. V. (1995). Estimating long-run relationships from dynamic heterogeneous panels. Journal of Econometrics, 68(1), 79–113.
Pesaran, M. H. (2004). General diagnostic tests for cross section dependence in panels. IZA
Programme, U. N. D. (2025). Human Development Index (HDI) database. Human Development Reports. Human Development Index data.
United Nations Development Programme, & Mohammed bin Rashid Al Maktoum Knowledge Foundation. (2025).
Verma, A., Giri, A. K., & Debata, B. (2023). The role of ICT diffusion in sustainable human development: An empirical analysis from SAARC economies. Environmental Science and Pollution Research, 30(6), 14518–14532. https://doi.org/10.1007/s11356-022-23174-7
Word Bank, (2026). World Development Indicators [Data set. World Bank. https://databank.worldbank.org/source/world-development-indicators
Zhang, J. & Danish. (2019). The dynamic linkage between information and communication technology, human development index, and economic growth: Evidence from Asian economies. Environmental Science and Pollution Research, 26(26), 26982–26990
Discussion Paper No. 1240. Institute for the Study of Labor (IZA).